Reading the White
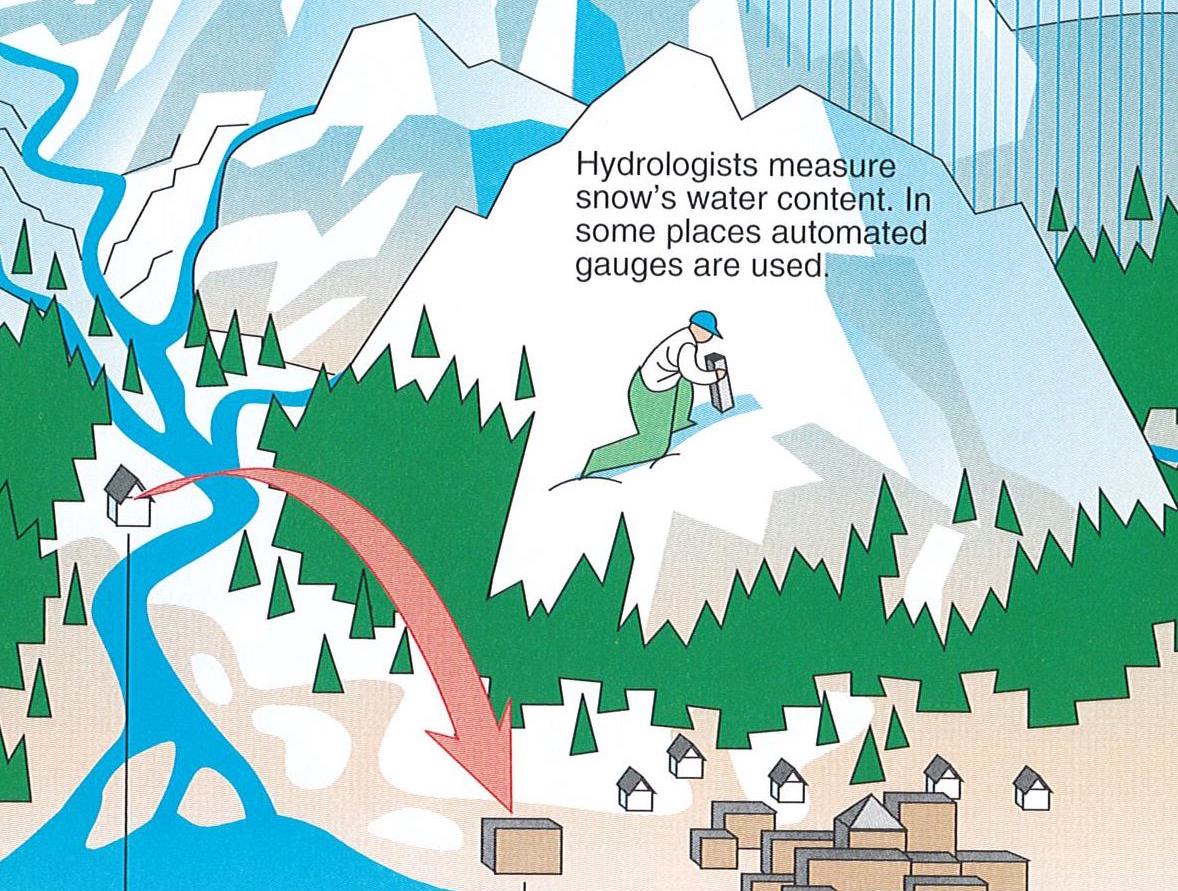
One of the nicest graphics I know of for explaining how water forecasts are made. This graphic was conceived by Jack Williams, and drawn by the staff of USA Today, under the direction of Richard Curtis. “How Hydrologists Forecast Floods, Water Supply,” in The Weather Book: An Easy to Understand Guide to the USA’s Weather (Vintage Books, 1992): p. 91.
It’s the second week of March, which means it’s time for the release of the latest update to Bulletin 120. Maybe that means nothing to you, but for the people who manage California’s water supply, it’s an important moment. If you live in California, or if you eat anything irrigated by the water released as the snow melts in the Sierras—almonds, broccoli, oranges, garlic, and on down the produce aisle—then the contents of Bulletin 120 matter to you.
Bulletin 120 is not much to look at: just two pages of plain white paper, with two tables of numbers. It’s a forecast of how much water the spring melt will produce, broken out by the names of US Geological Survey stream gauges up and down California.
Boring, but avidly read. The people who operate dams and reservoirs use these forecasts to judge how much of the spring melt they can capture, as they try to balance the coming summer needs of a thirsty state with their obligations to try to prevent flooding when seasonal storms hit. City water managers use the forecasts as they anticipate what kinds of conservation measures they may have to implement. For farmers who can switch between different crops, these numbers may determine what crops they plant for the coming growing season. Electrical utilities can get a sense of how much hydropower will be available, and how much they may need to fire up more expensive supplemental power plants. Measurements of snow pack can shape natural gas prices on markets thousands of miles away.
Latin scholar and pioneering snow surveyor James Church. Image courtesy of the National Water and Climate Center, USDA.
These numbers are produced by analysts for the California Cooperative Snow Surveys, who in turn rely upon a small army of hardy souls who tromp into the mountains. Using standardized, spring-loaded metal tubes called “Federal snow samplers” first developed in the 1890s and little changed since, these snow pack measurers walk preset snow courses laid out in mountain meadows. This method was pioneered by James Church, a classics professor at the University of Nevada, Reno in the early 20th century.
In recent decades, automated electronic “snow pillows” and aircraft-based surveillance has complemented manual measurements. Analysts plug snow measurements into formulas that have been empirically constructed using historical data, yielding a number of thousands of acre-feet of water predicted to flow past stream gauges between April and June.
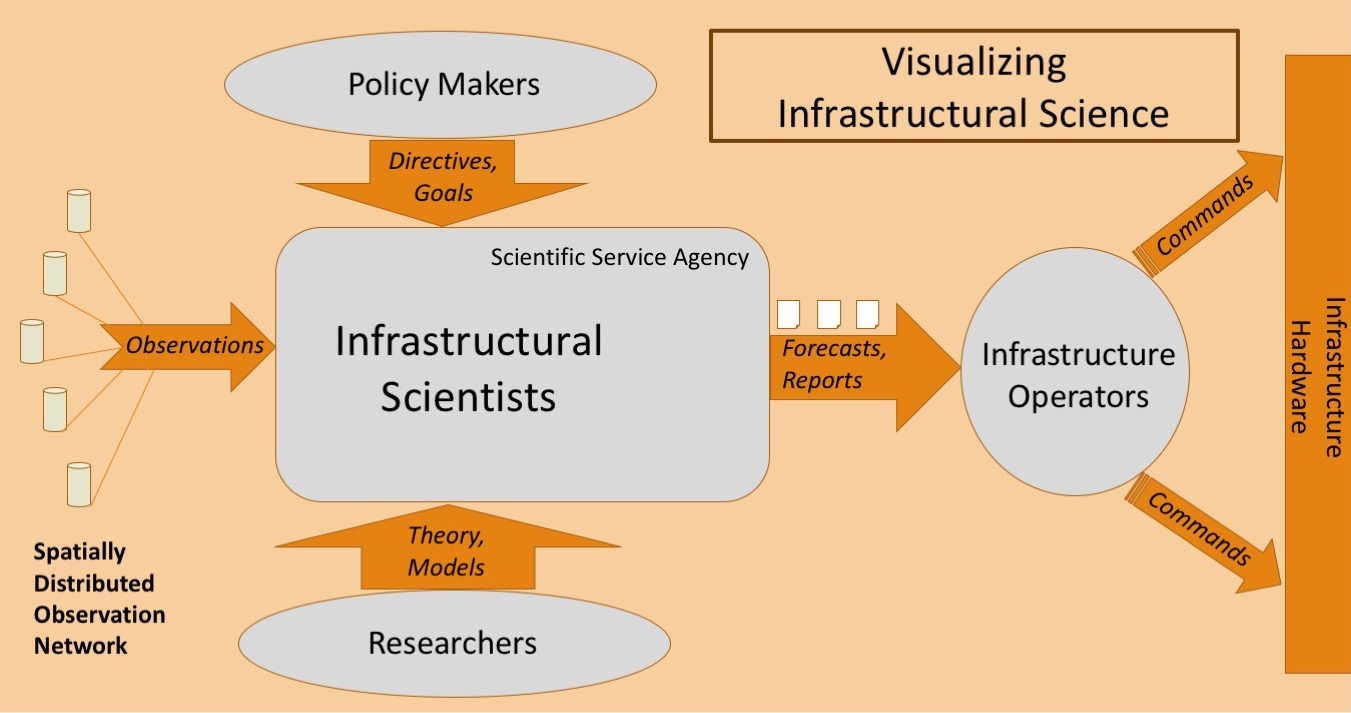
Snow pack monitoring is a remarkable combination of routine, long established work practices that produces dull data crucial to the apparent stability of the infrastructure that enables our modern ways of life. It’s a textbook example of infrastructural science.
Learn More
- James Urton and Kim Smuga-Otto, “California drought: Sierra snowpack measuring is a lot more complex than it looks,” San Jose Mercury News, January 29, 2015.
- California Cooperative Snow Surveys, “The Impact of Forecasting.”
- Jack Williams, “How Hydrologists Forecast Floods, Water Supply,” in The Weather Book: An Easy to Understand Guide to the USA’s Weather (Vintage Books, 1992): p. 91.
- National Water and Climate Center, US Department of Agriculture. “Program History.”